
Home made efficient tandem coupling of TG/DTA and MS equipment
18 Jul 2020In principle, the coupling of these two units is straightforward, a portion of the exhaust gas from the TG/DTA unit is diverted for sampling in the MS quadrupole unit for subsequent m/z analysis.
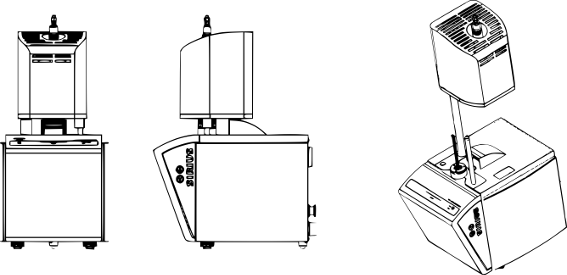
Depending on the TG/DTA model, it may be possible to find a specific commercial accessory to make this connection between both units. However, this accessory is not always available for a specific TG/DTA model. Usually, this accessory is designed for TG/DTA equipment including a horizontal type furnace or hot chamber with no moving parts attached to this part of the equipment. In this case, the differential thermal balance TG-DTA2000SE (Sirius) from Netzsch is a moving vertical electric furnace that uses a retractable head that allows access to the sample location for measurement analysis. The exhaust is located on the top of this moving head that covers the sample stage.
 |
|---|
| The differential thermal balance TG-DTA2000SE (Sirius) by Netzsch |
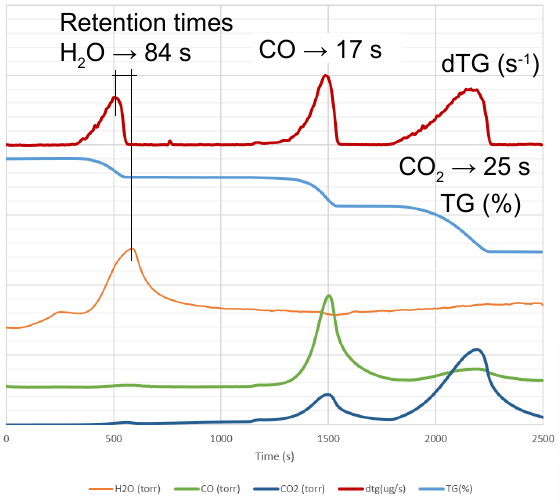
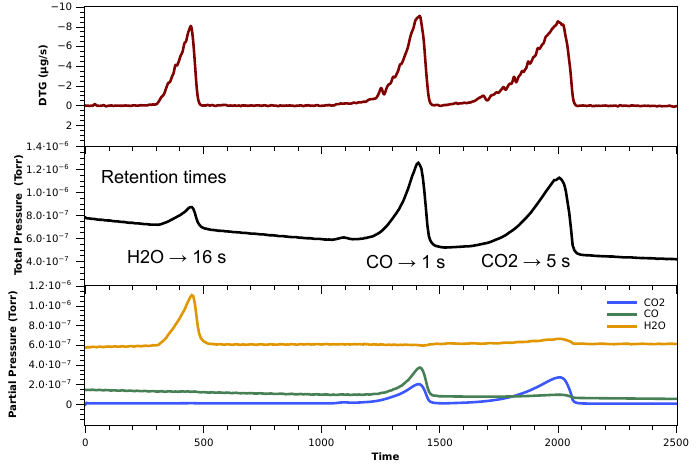
There is no coupling accessory for this equipment in order to take in-line samples for the MS quadrupole. Then, a T-shaped connector can be placed in the exhaust output and feed the MS device directly. However, by doing that, there is a remarkable delay between the maximum observed peak of the DTG trace (derivative of the TG trace or mass flow) and the total/partial pressure detected by the MS equipment. The thermal degradation of the standard calcium oxalate material shows especially a large delay of 84 seconds for the peak related to the water portion release.
 |
|---|
| TG and calculated DTG traces from the TG/DTA equipment and partial pressure measured in the MS equipment. During the test, a 100 ml/min inert gas was used as carrier gas flow. |
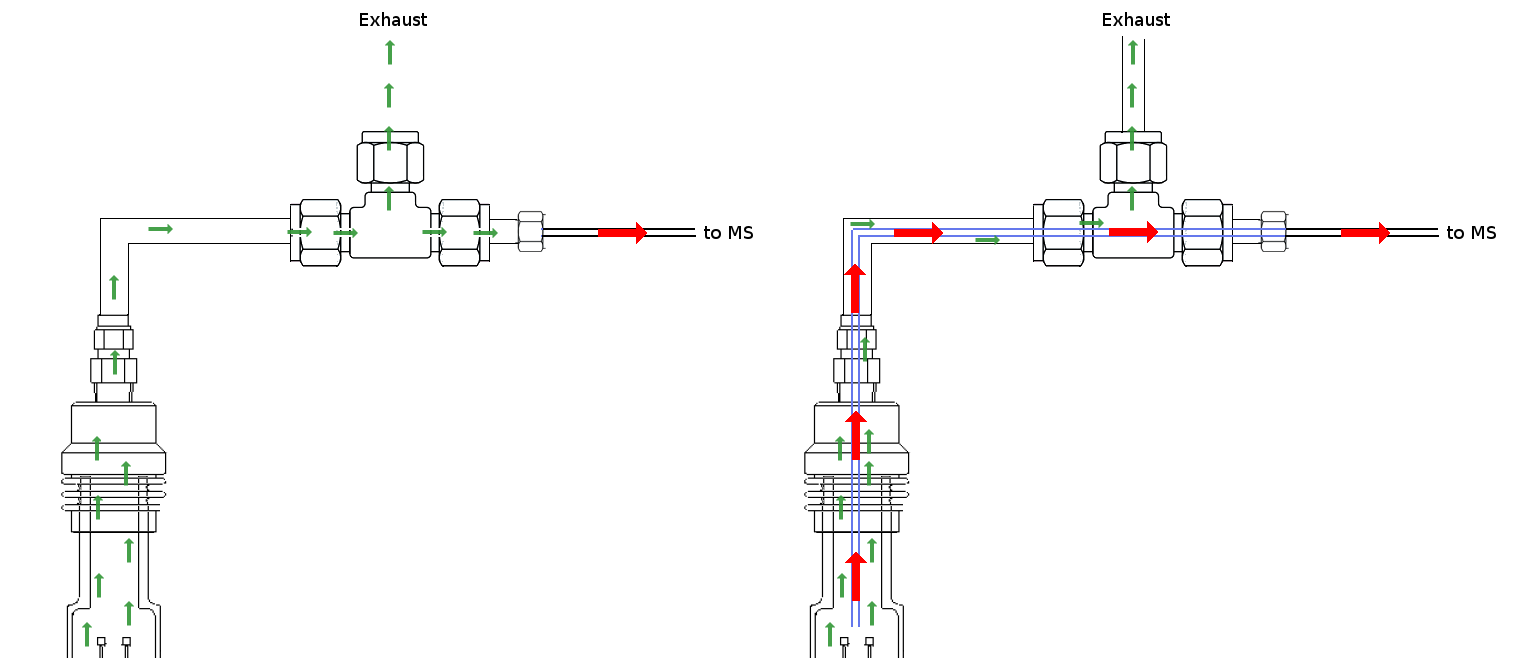
Despite sampling being done as close as possible to the exhaust of the TG/DTA equipment, this delay could be alleviated if sampling could be done internally close to the sample stage by using a metallic capillar. In this way, the gas volumetric flow for sampling would be instantaneous equal inside the TG/DTA and the fused glass silica capillar from the MS equipment. The scheme below depicts the conventional attachment and the capillar based sampling procedure.
 |
|---|
| (Left) conventional sampling from T-shaped connector and (right) sampling using inner capillar close to the sample stage. Red and green arrows denotes fast and slow flow, respectively |
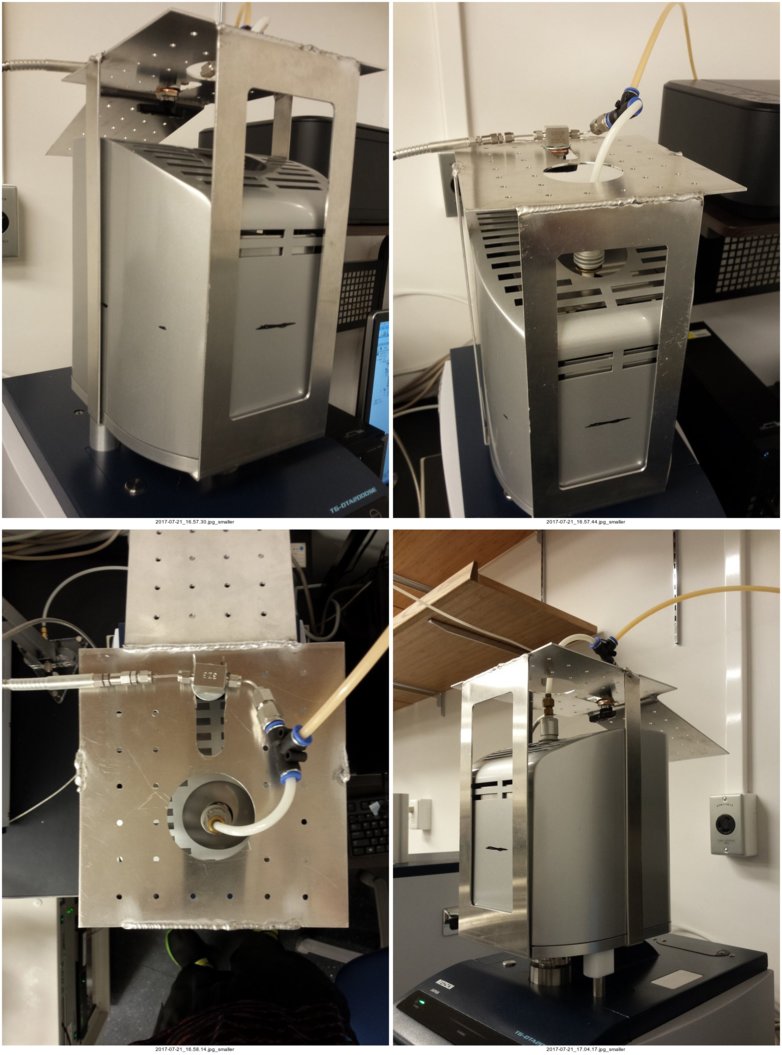
After that, the problem becomes how to hold this concentric capillar inside the main exhaust line considering that the oven head of TG-DTA2000SE is a mobile part. It could be problematic because the capillar input is placed just 1/2 cm above the sample boats and, therefore, a tight holding between the accessory and system is necessary. The tight holding was solved by designing a helmet for the oven head where external piping, valve and concentric capillar are attached and moving solidary to the oven-head.
 |
|---|
| Helmet holding exhaust and capilar lines in the head of the movable oven |
The improvement minimizing the delay upon calcium oxalate gas releaseases measured in both equipment is remarkably good compared to the conventional sampling strategy.
 |
|---|
| TG and calculated DTG traces from the TG/DTA equipment and partial pressure measured in the MS equipment using inner capillar for the connection of both equipment. |
A blueprint for the helmet design can be downloaded here.
This TG/DTA helmet accesory was used recently for detecting released gas compounds from hybrid halide perovskite.1, 2 Please cite one of these articles if you find useful the blueprint of the helmet for coupling your devices.
-
Juarez-Perez, E.J., Ono, L.K., Maeda, M., Jiang, Y., Hawash, Z. and Qi, Y. Photodecomposition and thermal decomposition in methylammonium halide lead perovskites and inferred design principles to increase photovoltaic device stability 2018 J. Mater. Chem. A Vol. 6, pp. 9604-9612 ↩
-
Juarez-Perez, E.J.,* Ono, L.K. and Qi, Y. Thermal degradation of formamidinium based lead halide perovskites into sym-triazine and hydrogen cyanide observed by coupled thermogravimetry - mass spectrometry analysis 2019 J. Mater. Chem. A Vol. 7, pp. 16912-16919 ↩